Last significant update: 7 March 2023
I’m an independent software engineer (LinkedIn) specialising in mathematical modelling and statistics. After working as a researcher at GiveWell in San Francisco, I became a full-time software engineer. I spent some time at GoCardless, a London FinTech company, and these days I’m an independent consultant. My focus is software engineering work with a mathematical or statistical component.
I combine knowledge of statistics, numerical analysis, and software engineering best practices to produce efficient models that can be trusted and relied upon. I build maintainable software systems with helpful abstractions for model users.
While I have delivered projects with a high level of mathematical sophistication when this was appropriate, my approach to consultancy work is focused on solving your problems with the least hassle and complexity.
Here are some projects I’ve worked on:
- The optimal timing problem for philanthropy. Given investment returns and how the world is changing over time, how fast should a philanthropic foundation spend its endowment? I took a collection of untested R scripts to a production-ready Python codebase with thorough tests and a CI pipeline. The system this replaced was already influencing major decisions about the timing of many hundreds of millions of dollars of grants by Open Philanthropy; the system I created is expected to be used for years to come. (More)
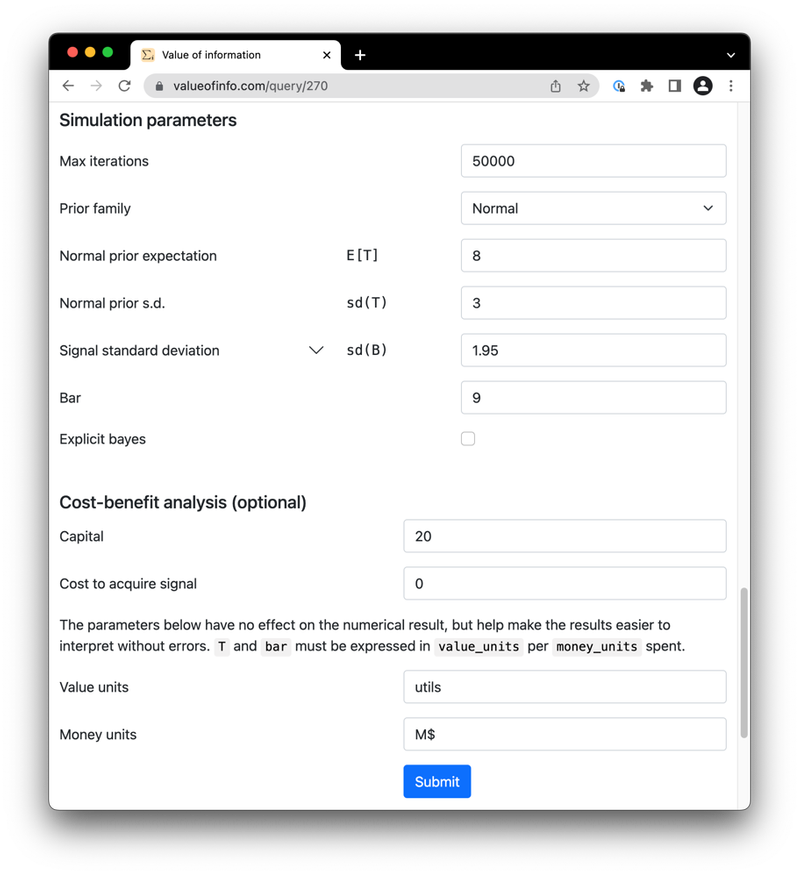
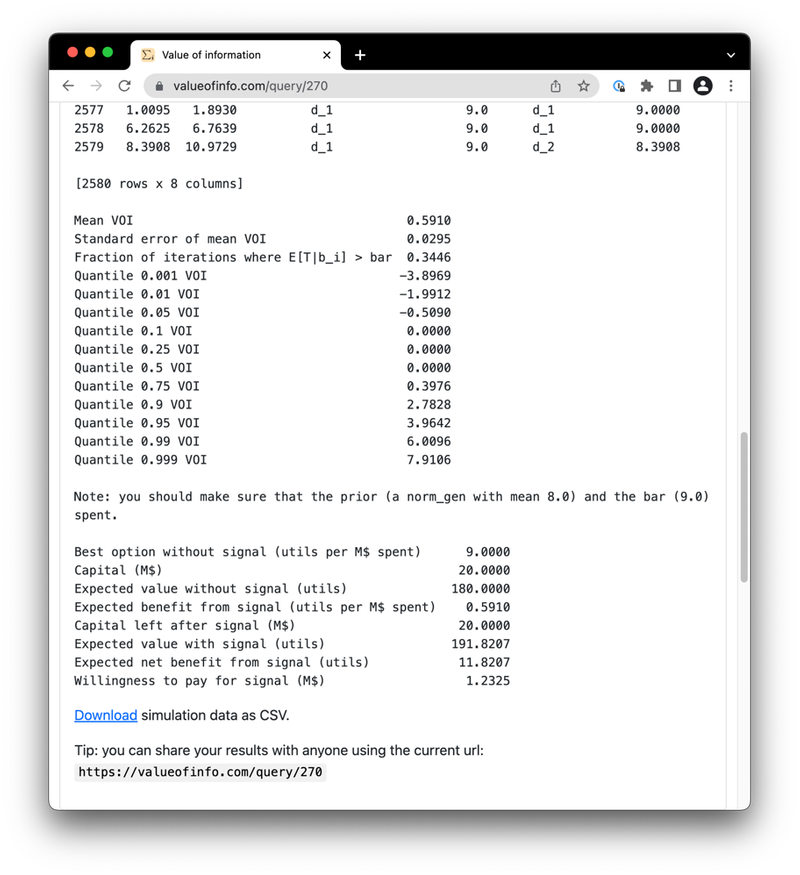
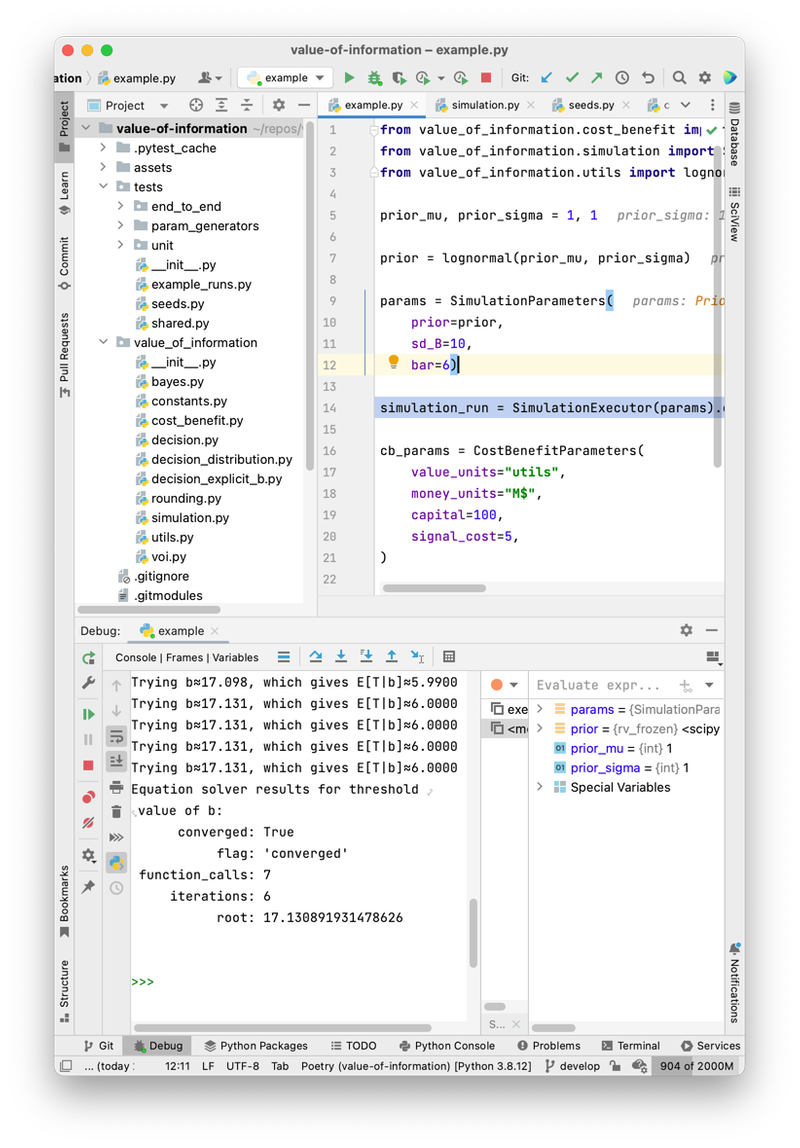
- Calculating the value of information. A decision-maker faces an uncertain choice, but they may pay to get a noisy signal that would inform the decision. Given the decision-maker’s prior belief and the properties of the signal, what’s the expected improvement in decision from receiving the signal? And given the stakes of the decision, how much should they be willing to pay for the signal? (More)
- Reduced the runtime of an existing model by 30x. A model developed by my client was running slowly. A basic sensitivity analysis took about half an hour, while more ambitious sensitivity analyses or Monte Carlo simulations would have been prohibitive. I was hired after they had already spent dozens of hours trying to make it faster. By attempting a wide range of techniques, I was able to find two changes that delivered a 30x speedup on the sensitivity analysis. These changes were also selected to be simple to reason about, easy to maintain, and robust to changes in the model. (More)
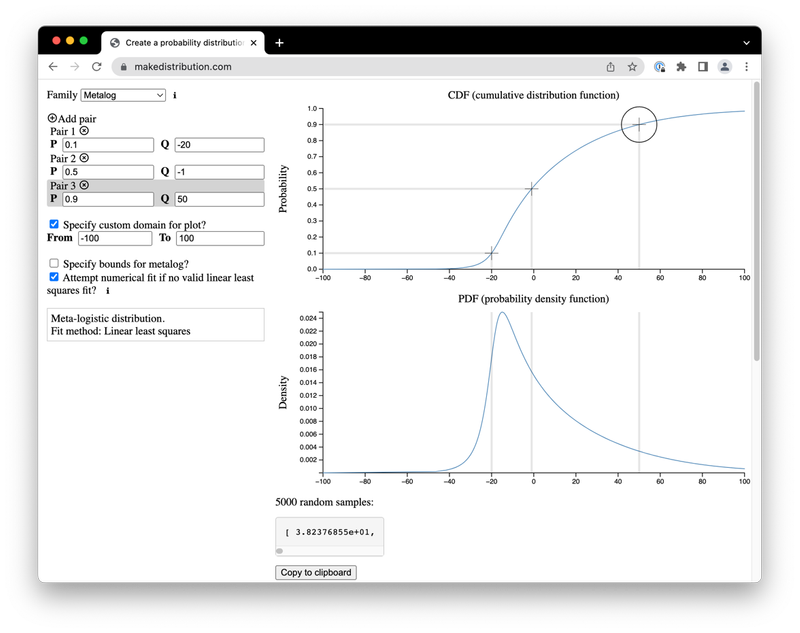
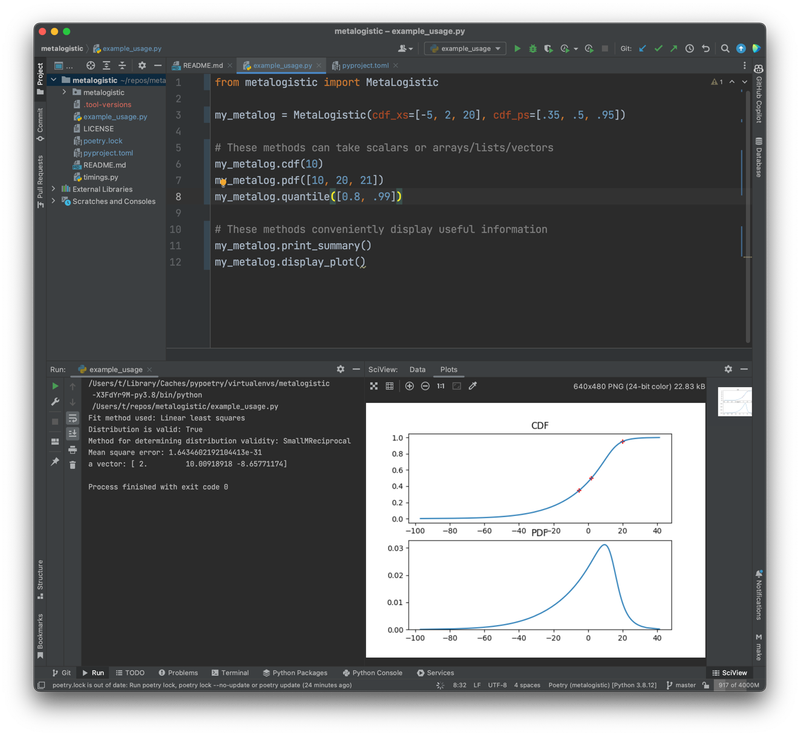
- Python implementation of a novel probability distribution. The metalogistic (or metalog) distribution is a new (2016) continuous probability distribution with a high degree of shape flexibility and an unusual design. Instead of using traditional parameters, the distribution is parametrized by points on a cumulative distribution function (CDF). The distribution is well suited to eliciting full subjective probability distributions from a few CDF points; the result fits these points closely (often exactly) without imposing strong shape constraints. (More)
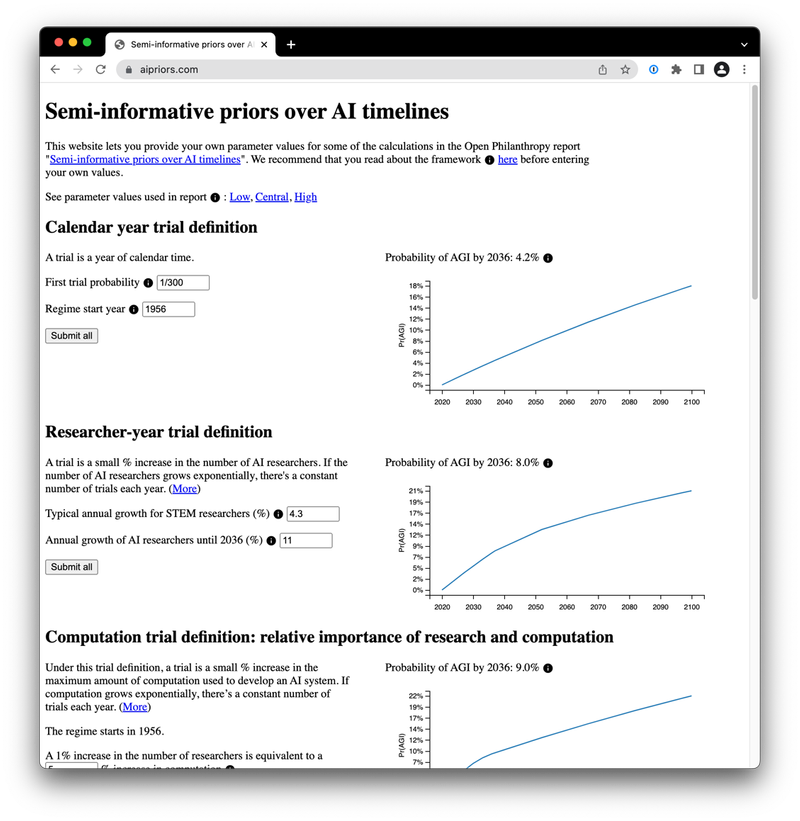
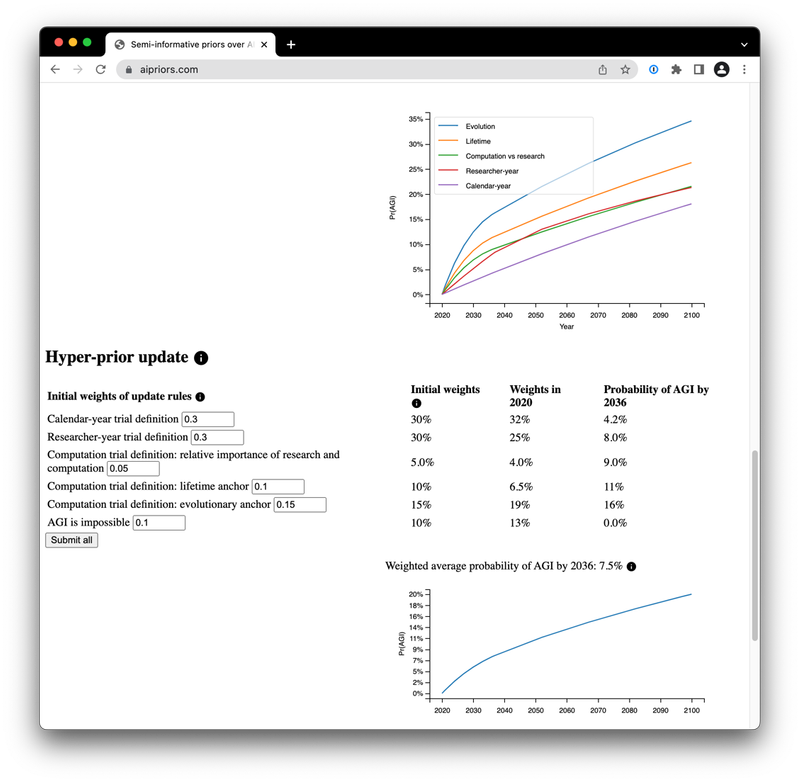
- A mathematical model for forecasting the chance of success in projects of unknown difficulty. I implemented a model for forecasting the chance of success in projects of unknown difficulty, applied to the possibility that advanced AI may be developed. My work provided an independent check of the numerical results in a research report. I also enabled more people to interact with the model by deploying it to a simple web interface. (More)
Consulting track record
The optimal timing problem for Open Philanthropy
- 2022
Open Philanthropy is a large philanthropic foundation (≈8bn) focused on funding the initiatives with the highest humanitarian impact.
Open Philanthropy faces an optimal timing problem1: given investment returns and how the world is changing over time, how fast should it spend its endowment?
My client had developed an existing system to attempt to model this problem within one of their focus areas, global health and development. This was a collection of R scripts that had grown unwieldy and hard to reason about; it also had no test suite. Yet this system was already influencing major decisions about the timing of many hundreds of millions of dollars of grants. Moreover, Open Philanthropy continue to face this optimal timing problem for the foreseeable future.
Given the stakes, my client saw a necessity to be much more confident in the correctness of the code, as well as a need to invest in long-term maintainability. I was hired for this task. I took a collection of untested R scripts to a production-ready Python codebase with thorough tests and a CI pipeline. This new codebase is expected to be used for years to come.
The major source of value I provided was producing high-quality, maintainable code with an extensive test suite. I did so independently and required only occasional input from my counterparts. Apart from software engineering skill, this required a good understanding of basic economic theory, and enough background knowledge about Open Philanthropy and its approach to the problem. Since I wrote the entirety of the new codebase, I had to understand every detail of the model.
Parametrized tests
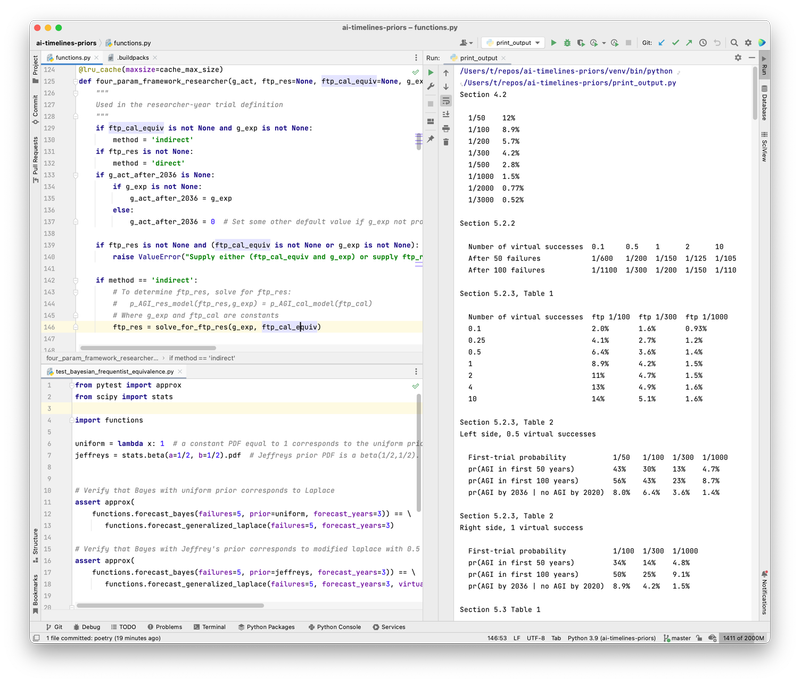
One notable aspect of the project was that I made extensive use of parametrized tests in the test suite. Parametrized tests check that an assertion holds not just for one set of parameters, but for all sets of parameters that are supplied.
When designing unit tests, I was often able to come up with invariants, i.e. properties of a function or method that should hold for all parameter values (in some range). When testing invariants, I did not need to specify the list of inputs manually; instead, I defined a few values for each parameter and let pytest assemble the list of all combinations of these options, which could number from dozens to over a thousand.
This method is somewhat uncommon in mainstream software engineering applications (e.g. building web APIs), because it may produce large numbers of superfluous test cases, and arguably makes test suite code less readable. However, I think this technique was very well suited to this project, for at least three reasons.
First and most importantly, when testing a numerical function, say f(A), to merely assert for one specific value a that f(a) takes the value x provides essentially no independent check against error. The code for the test case would just repeat the numerical expression that defines f in the application code. If I made a conceptual, algebra, or transcription error in the original code, I am highly likely to repeat that error when writing the test. Using parametrized tests is often a necessity, not a luxury.
Second, in this project I was writing bespoke mathematical functions that should model some real-world phenomenon (as opposed to producing a general-purpose numerical tool such as an equation solver). In such a situation, there is no “textbook” answer that can be used as a source of truth. In addition, in my experience the greatest risk is that of making a conceptual error, for example using different interpretations of a parameter in different parts of the program, or assuming that a utility function must take positive values2. Coming up with invariants by thinking about the model at a higher level and using intuition about the phenomenon being modelled can be a very effective check against error in this context.
Third and finally, this is an important piece of software where we desire very high confidence that the code is correct, while at the same time the model is sufficiently complex that bugs could go unnoticed for a long time. It is worth trading off some convenience to get a more robust test suite.
Drawing correlated random samples
This model incorporated parameter uncertainty by using Monte Carlo simulation. Instead of all parameters being statistically independent, my clients were interested in modelling dependencies between parameters. In particular, they wanted to specify the joint probability distribution over n parameters as a set of n marginal distributions and an n*n matrix of correlations between them. I was not familiar with how to do this, but through some research discovered that copulas were a standard technique. My client’s implementation in their R scripts turned out to be equivalent to the Gaussian copula.
The Python statsmodels package has a good set of functionality related to copulas. However, I found the statsmodels interface unintuitive. I therefore created the separate copula-wrapper package, which abstracts away copula-related considerations behind a high-level interface. The interface lets the user specify marginal distributions (as SciPy objects) and correlations, and returns the joint distribution as another SciPy continuous distribution object.
Although my clients were happy for me to develop the copula-wrapper package just for this project, a few weeks later a colleague from a different part of Open Philanthropy reached out to let me know that they were now also using the package for their own unrelated Monte Carlo simulation.
Value of Information
- 2022
- GitHub repository
- Web interface (and its GitHub repository)
- Non-public blog post (contact me)
Semi-informative priors for AI forecasting
Laplace’s rule of succession is often used to make forecasts about the probability of unprecedented events. Laplace’s rule corresponds to having an uninformative prior over the probability per period (e.g. per day or per year). Tom Davidson, a researcher at Open Philanthropy, developed a mathematical model to forecast when advanced artificial intelligence may be developed, based on extensions of Laplace’s rule that can incorporate some additional information and thus correspond to “semi-informative” priors.
I was hired to provide an independent check that the model’s implementation was correct, and improve the legibility of the code. It emerged that the best way to do this was for me to re-implement the model from the ground up, based on its description in the draft report rather than the existing code written by Tom. When the results coincided, this greatly increased our confidence in the code. My work let us uncover and fix some minor errors in the report.
I then deployed the model to a simple web interface at aipriors.com where users could modify key parameters. This lowered the barrier to entry to using the model, allowing more people (inside and outside of Open Philanthropy) to engage with this relatively complex piece of research.
After originally suggesting the idea, I handled all aspects of this web interface. I developed a small Flask application to serve the model and display plots, and configured and deployed the necessary infrastructure in Amazon Web Services. Since the model approximates continuous time with small slices of discrete time, I used a more coarse-grained approximation in the web deployment; this made the model much more usable at a small cost in precision. I also improved performance by caching the results of user queries.
Reducing the runtime of an existing model by 30x
- 2023
- Shorter project
Epoch is a young research organisation focused on forecasting long-term progress in artificial intelligence. One of Epoch’s major projects is a mathematical model that incorporates an endogenous growth model – it models the effect of increasingly advanced AI capabilities on gross world product and on investment in AI hardware and software.
This model was running slowly. One execution of the model took 1-2 minutes. The most basic sensitivity analysis envisioned by Epoch required running the model on 24 sets of parameters, which took 25 minutes to an hour. More sophisticated approaches to modelling uncertainty, such as Monte Carlo simulations and sensitivity analyses based Shapley values3, would have required at least thousands of executions of the model – with an execution time ranging from highly impractical to prohibitive.
I was hired after the researcher who developed the model and wrote the original code had already spent dozens of hours improving the runtime. He had done so with some success, but was struggling to achieve a sufficient speedup.
I investigated many potential speedups that seemed promising based on experience, first principles, or profiler results. I only selected two to implement in the final version, based not only on their effect on the runtime but also for being simple and largely independent of the details of the model. I implemented in my client’s codebase two changes that were simple to reason about and easy to maintain, but nonetheless delivered a 30x speedup for sensitivity analyses.
I also set up logging, profiling, and benchmarking infrastructure. First, this infrastructure helped me work productively on this project. Second, it also allowed me to demonstrate in a short summary document (with links to log files) how much my speedups improved runtime, and that my changes did not affect the numerical results. I handed over this infrastructure to my client on a separate branch.
This was an inherently uncertain project: without knowing the codebase, it’s very difficult to forecast what speedup will be achievable. During the project, I communicated closely with my client about the progress of the work, and the potential returns to further investment. Toward the end this engagement, I had done some exploratory work on a promising but more complex speedup4, but through my conversations with my client we were able to determine that the existing speedups already delivered enough value for their current needs. Their plans to conduct more sophisticated analyses that would especially benefit from additional speedups were at an early stage still. I was happy to work flexibly with this client, for as long as they were getting a good return on investment, rather than insisting on a precise scope at the beginning of the project.
Dynamic termination condition
The computational challenge of this model is that the agents that make the investment decisions in the model do so to maximise their long-run consumption. Consumption is endogenous and has a very complex specification. With 5 decision variables, and a 50-year time horizon, this is a 250-dimensional optimization problem. My client had done significant work on the optimization algorithm, and replaced default SciPy optimizers with the “adam” (adaptive moment estimation) algorithm, which seemed to perform well on the problem. However, adam was implemented with a hard-coded number of steps. I replaced this with a convergence condition that let the algorithm terminate when the objective (discounted consumption) was no longer changing much5. This focuses the computational effort where it is needed, and can also alert us to potential problems when the optimizer is not able to converge.
On the 24 parameter sets in the basic sensitivity analysis, this led to a 7x speedup on average.
Multiprocessing
The main dynamic optimization problem at the heart of the model is inherently hard to parallelize. However, multiple independent runs of the model are a perfect target for parallelization with few code changes. Sensitivity analyses or Monte Carlo simulations rely on such independent runs.
The sensitivity analyses had previously been running on a single CPU core. I instead implemented multiprocessing: running multiple instances of the model (inside multiple processes), to take advantage of multi-core architectures. On my laptop, using 6 cores led to a 4-5x speedup.
Infrastructure
At the start of the project, I set up logging, profiling, and benchmarking infrastructure.
Each execution of the model had its console output logged. Each log file also had metadata that was useful for this project:
- the runtime of that execution
- the hash of the current commit (i.e. the hash of
HEAD) - the diff between the working tree and that commit
When we want to quickly experiment with many potential changes (especially of a slow-running program), manually recording the results is not only a distracting chore it is also error-prone. These logging tools address this problem by automatically creating a record of the effects of each change, as you experiment.
I added the ability for any script to be run with cProfile profiling by setting a flag. The profiler results are saved to disk as a .pstats file and that file is linked to a log file that also has the metadata I described above.
Personal projects
For additional projects, see my GitHub profile.
A Python package (metalogistic) for a novel probability distribution
- 2020
- GitHub repository
- Web interface (and its GitHub repository) (this offers some other probability distributions too)
A Python implementation of the metalogistic or metalog distribution, as described in Keelin 2016.
The metalog is a continuous univariate probability distribution that can be used to model data without traditional parameters. Instead, the distribution is parametrized by points on a cumulative distribution function (CDF), and the CDF of the metalog fitted to these input points usually passes through them exactly. The distribution can take almost any shape.
The distribution is well suited to eliciting full subjective probability distributions from a few CDF points. If used in this way, the result is a distribution that fits these points closely, without imposing strong shape constraints (as would be the case if fitting to a traditional distribution like the normal or lognormal). Keelin 2016 remarks that the metalog “can be used for real-time feedback to experts about the implications of their probability assessments”.
intentions.page
- Web interface: intentions.page
- GitHub repository
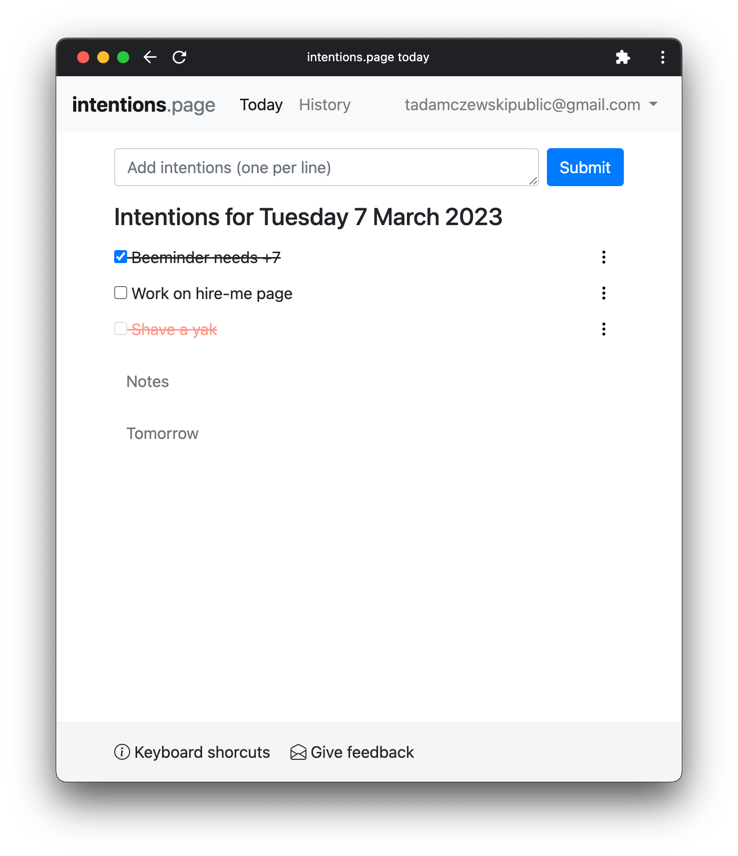
An opinionated task list designed to steer you towards intentions that feel alive and relevant, instead of long lists of old tasks. Currently, there are two power users that use intentions.page on a daily basis: myself and my partner. But anyone can sign up!
-
In fact, any philanthropist with a flexible endowment faces such an optimal timing problem, but Open Philanthropy is unusually interested in approaching this in a principled way to maximise impact. ↩
-
In fact, any affine transformation of a utility function represents the same preferences, so the absolute values of the function have no meaning and might well be negative. ↩
-
I believe that technically, Epoch did not use Shapley Values, but another conceptually similar approach. ↩
-
The idea was as follows. The optimizer needs an initial guess to start from. If a similar optimization problem has been seen before, the result of that problem could serve as a better initial guess than the constant (e.g. 0) that is otherwise used. This could save very large amounts of computation, so I was interested in this approach despite its higher complexity. The key difficulty is defining a “similar” optimization problem. If we already had a perfect distance function between sets of model parameters, there would be no need to conduct sensitivity analyses in the first place. However, there are two ways to mitigate this circularity. First, we do not need a perfect distance function, just one that is good enough to sometimes find a better initial guess in previous results. Second, we can use results of a basic sensitivity analysis, and our knowledge of the model, to attempt to construct such a “good enough” distance function. In this way the basic sensitivity analysis might allow us to pull ourselves up by our bootstraps, and save a lot of computation when running advanced sensitivity analyses or Monte Carlso simulations. ↩
-
I also experimented with gradient-based conditions. ↩
